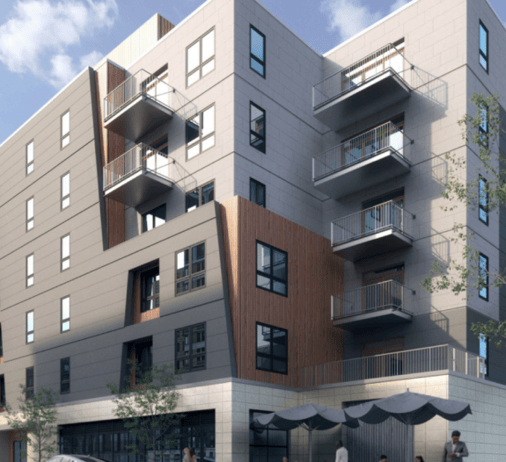
Charlestown, Allston/Brighton, Fenway, and South Boston market data
More neighborhood data for the neighborhoods just outside of the "core" downtown Boston neighborhoods. To reiterate: the annual data is pulled from MLS and contains sold properties occurring from January 1st of each year to September 29th of each year. I also added percentage changes for all rows both from 2007 to 2008 and from 2006 to 2008.
CHARLESTOWN |
2006 |
2007 |
2008 |
% change (from '07-'08) |
% change (from '06-'08) |
| Units Sold | 184 | 243 | 186 | -23.5% | 1.1% |
| Median Price | $431,000 | $435,000 | $415,500 | -4.5% | -3.6% |
| Days on Market | 122 | 120 | 120 | 0.0% | -1.6% |
| Volume | $88,166,740 | $118,288,612 | $88,309,450 | -25.3% | 0.2% |
SOUTH BOSTON |
|||||
| Units Sold | 371 | 473 | 328 | -30.7% | -11.6% |
| Median Price | $350,000 | $375,000 | $370,000 | -1.3% | 5.7% |
| Days on Market | 97 | 129 | 97 | -24.8% | 0.0% |
| Volume | $133,501,275 | $199,816,043 | $127,150,260 | -36.4% | -4.8% |
FENWAY |
|||||
| Units Sold | 127 | 124 | 125 | 0.8% | -1.6% |
| Median Price | $303,500 | $289,000 | $330,000 | 14.2% | 8.7% |
| Days on Market | 73 | 58 | 66 | 13.8% | -9.6% |
| Volume | $42,928,500 | $39,251,500 | $44,798,820 | 14.1% | 4.4% |
ALLSTON/ BRIGHTON |
|||||
| Units Sold | 423 | 431 | 290 | -32.7% | -31.4% |
| Median Price | $285,000 | $270,000 | $271,500 | 0.6% | -4.7% |
| Days on Market | 96 | 80 | 89 | 11.3% | -7.3% |
| Volume | $124,670,164 | $138,022,677 | $89,838,345 | -34.9% | -27.9% |
I should have some thoughts on this data and the previous post tomorrow...
